Heads up! The screenshots in this article are from Clipchamp for work accounts and the same principles apply to Clipchamp for school accounts. Clipchamp personal account tutorials may differ. Learn more.

Create engaging workplace videos powered by accurate video analytics that can help you understand if your video resonates at work, with your customers, or online viewers. Video analytics can be used to guide your business video strategy, choose video topics or video editing styles, and improve your upcoming video engagement.
Understand the performance of videos at work using the detailed analytics available in Clipchamp. Deep dive into your video’s viewership, watch time, and engagement on a daily, weekly, or 3-monthly basis. You can also analyze the success of your interactive video forms and callouts.
Learn how you can easily access video analytics in Clipchamp and get inspired by three actionable ideas on how to use these insights to make better videos for work.
How to view video analytics in Clipchamp
Step 1. View your video in Clipchamp
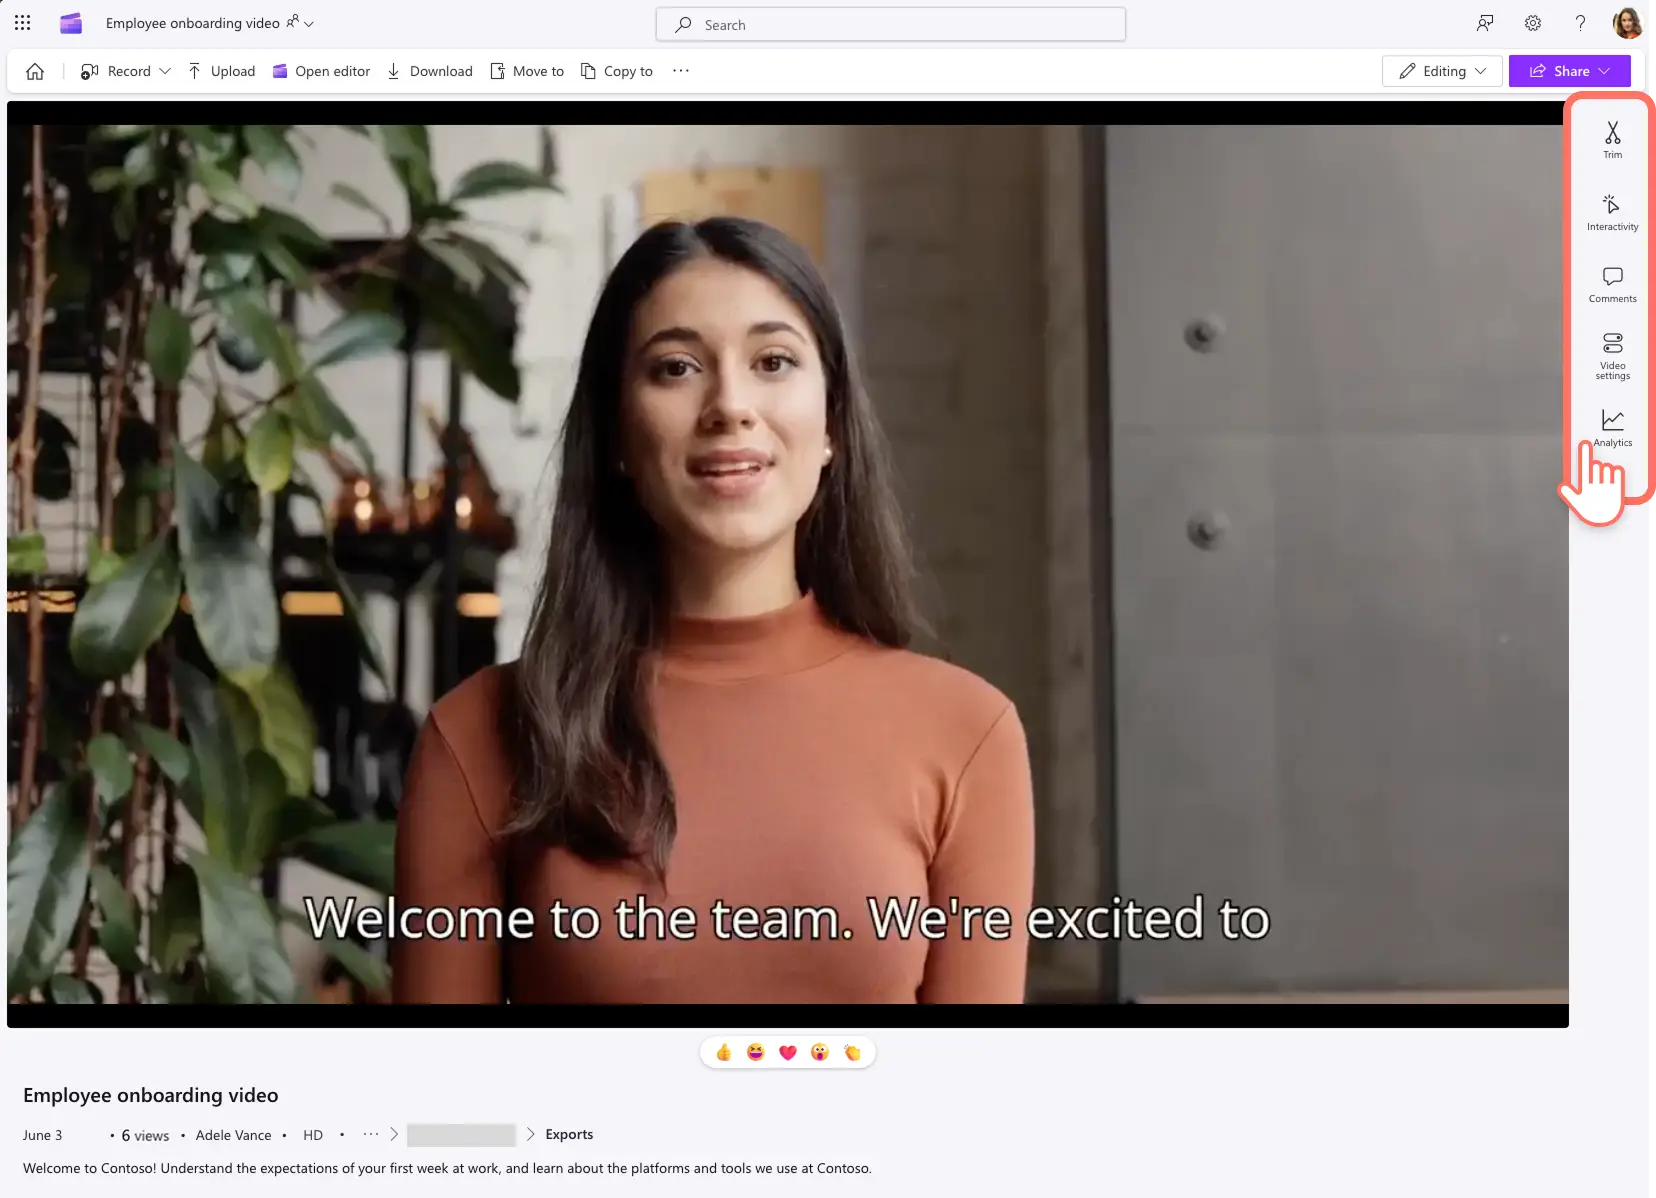
Open your video in Clipchamp. Scroll through the toolbar which features a range of tools to help your trim a video, add comments to the video, and change video settings. Select the analytics tab to review your online video streaming metrics.
Note: you need to be a video owner or member of the SharePoint site where the video is stored or have edit access to the video to preview analytics in Clipchamp.
Step 2. Review detailed video analytics
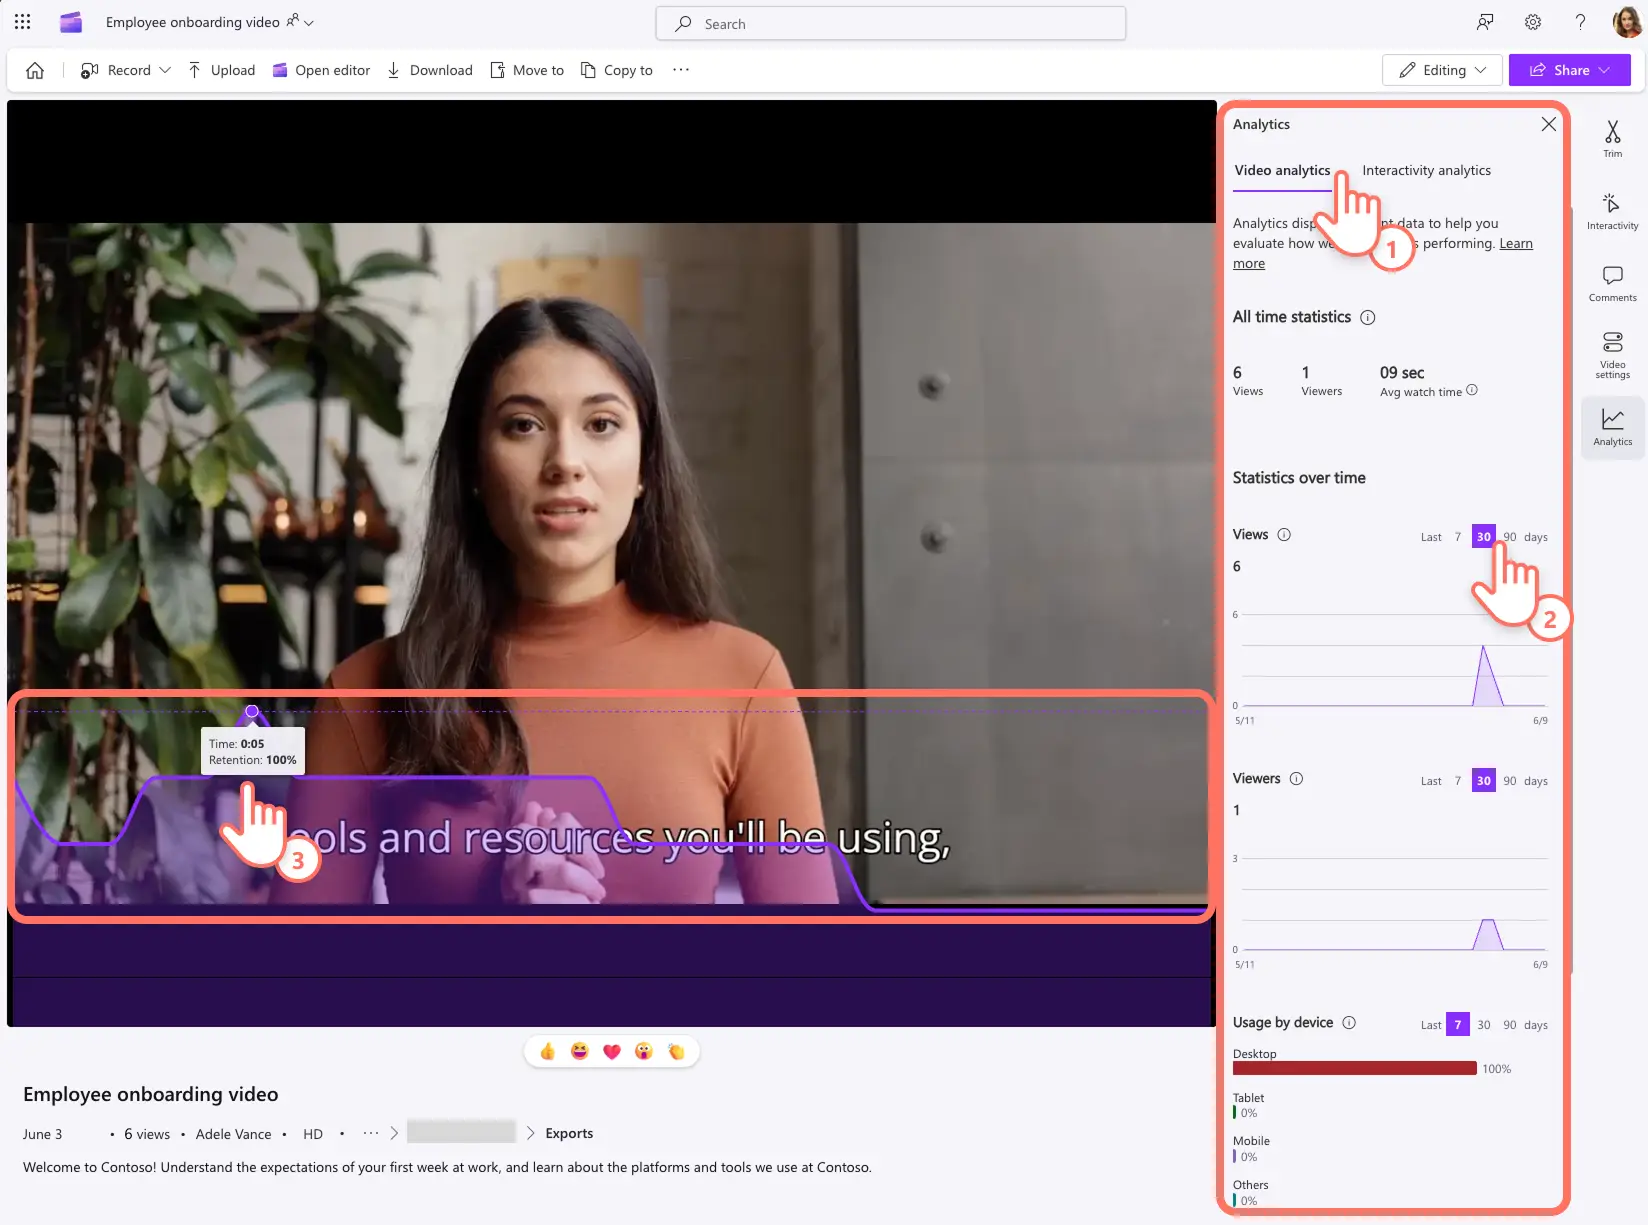
Choose from video analytics or interactivity analytics in the analytics tab to dive deeper into your video’s performance.
In the video analytics dashboard, you can review all time statistics such as total views, number of unique views, and average watch time. Additionally, you can review views, viewers, usage by device, as well as views by geolocation in a range of timeframes like 7 days, 30 days, or 90 days.
While you're in the analytics tab, a viewership retention graph will appear on top of your video with metrics per timestamp. Hover of this graph to identify the parts of your video which get the most engagement and where viewership drops off. Close the analytics tab to exit this graph view of your video streaming analytics.
Step 3. Review interactivity analytics
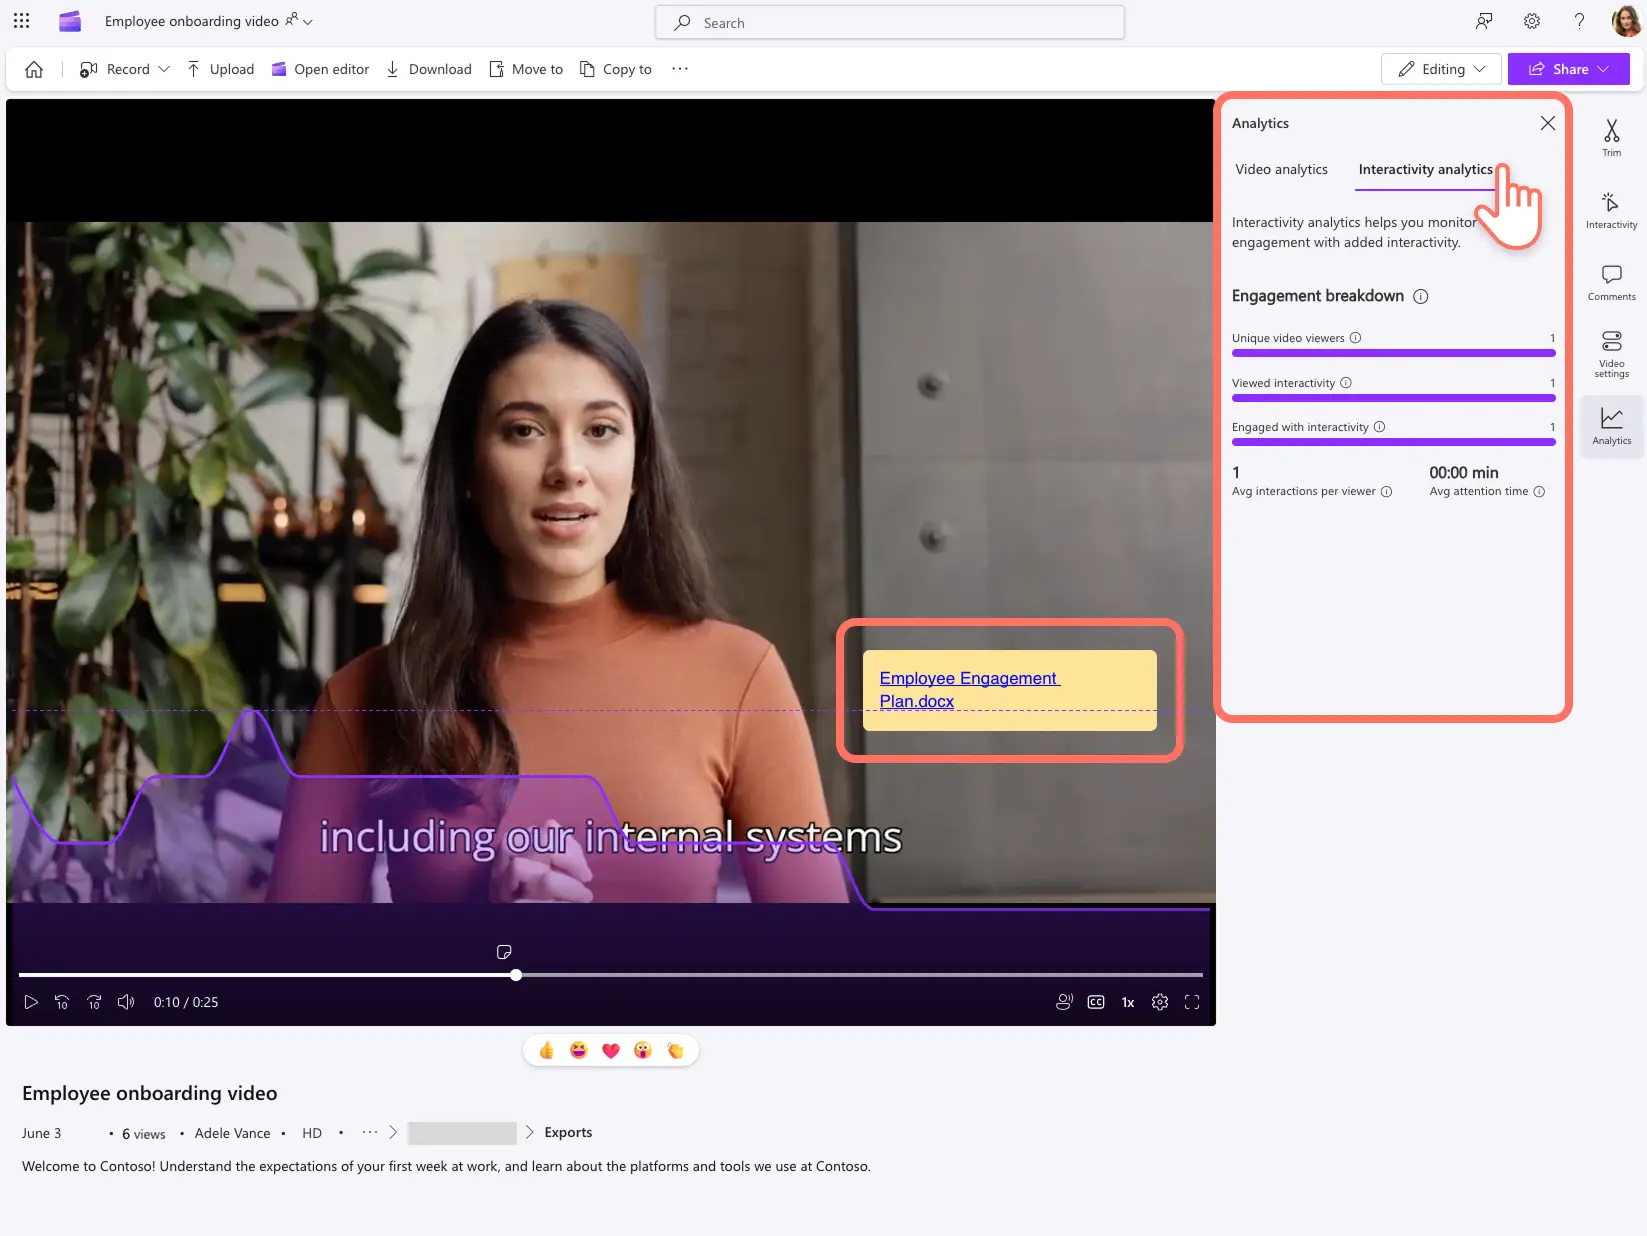
If you add forms and callouts into your video, the metrics can be reviewed in the interactivity analysis dashboard. Review the engagement breakdown, including how many viewers saw the interactive element and how many engaged with the form or callout.
The average interaction per viewer is an interesting metric if your video contains more than one interactivity element. Lastly, there is an average attention time estimated per interactivity element.
How to use analytics to make work videos
Inform video topic selection
The video analytics metrics can be used to make informed decisions about existing and upcoming videos. Users can review the most viewed and least viewed parts of a video to identify which talking points resonate with viewers. Similarly, geolocation data can help make decisions about what language and AI voice accent to make content about the workplace, customers, and other key viewing audiences.
Choose video formats and styles
Users can compare their videos to identify which format and editing style are more engaging. For example, the culture team can track and compare the viewership of their different internal communication videos, such as company mission video, how to videos, event highlight videos. Based on their popularity, they can choose to create more videos in a certain format and style.
Identify areas of improvement
The second-by-second video retention graph can be used to compare frames and try to analyze the reason for a drop in engagement. Improvements like changes in video script, forms, callouts, recordings, stock video selection, and video editing can be decided upon. For example, easy video editing touches like adding transitions, video effects, and ambient background music can be used to turn basic company announcements into an engaging watch.
Now that you’re ready to analyze videos in Clipchamp, explore how to improve future video projects with custom work video templates and Windows screen recordings.
Get started making video for your business with Clipchamp or download the Microsoft Clipchamp Windows app.
Frequently asked questions
How long does it take for video analytics to be updated?
The video analytics in Clipchamp and SharePoint are updated in real-time so you can always track your video’s performance with clarity.
Can my video analytics be transferred if I edit and republish my video?
Editing and saving a video with the same name, extension, and video location will reset all video metrics except view and viewer count. Clipchamp recommends saving and reuploading a video to get accurate analytics.
How can I increase my video retention at work?
Increase video retention by adding interactive elements or through enhanced video editing. For example, increase the retention of a video presentation by adding callouts and forms in Clipchamp. You can also record a webcam intro which provides details of the video agenda and grabs your viewers’ interest.