
TikTok's biggest trends right now (2026)
Blog
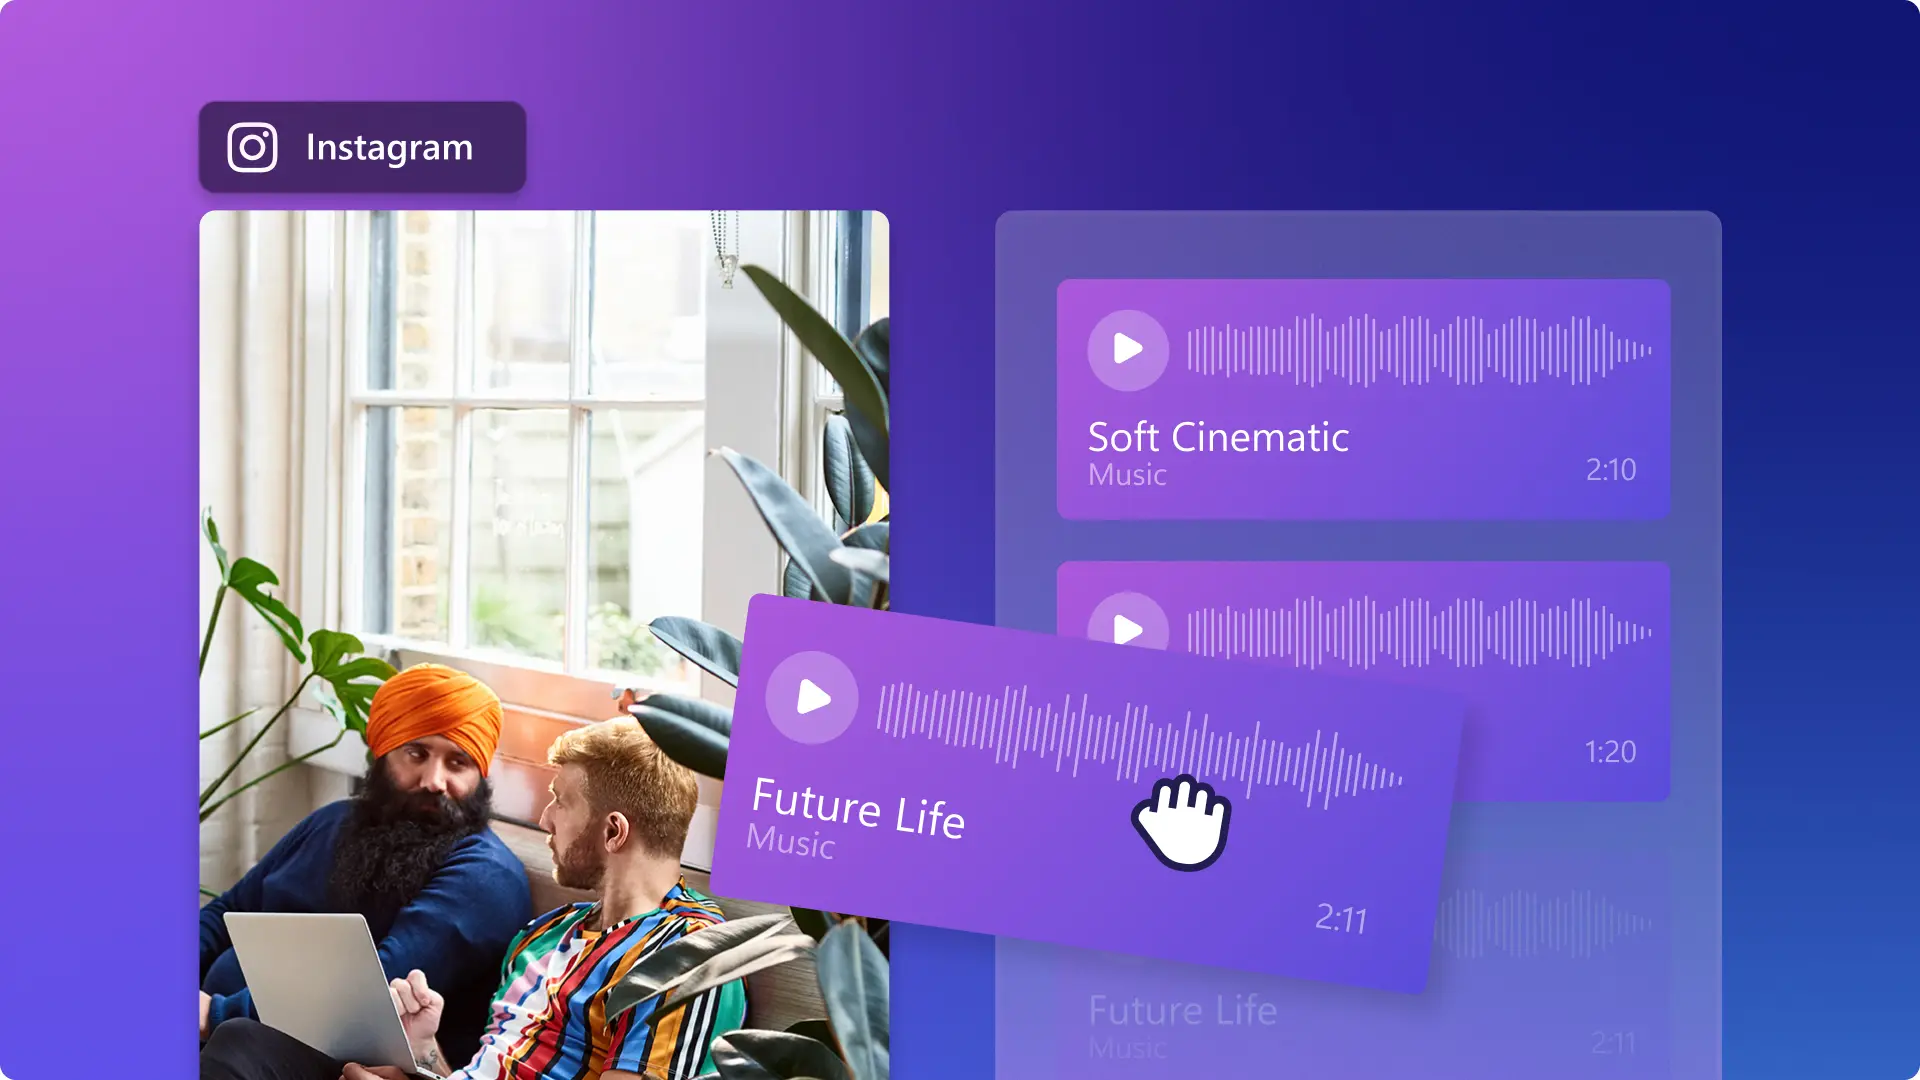
How to add music to Instagram videos: Stories, Reels, and posts
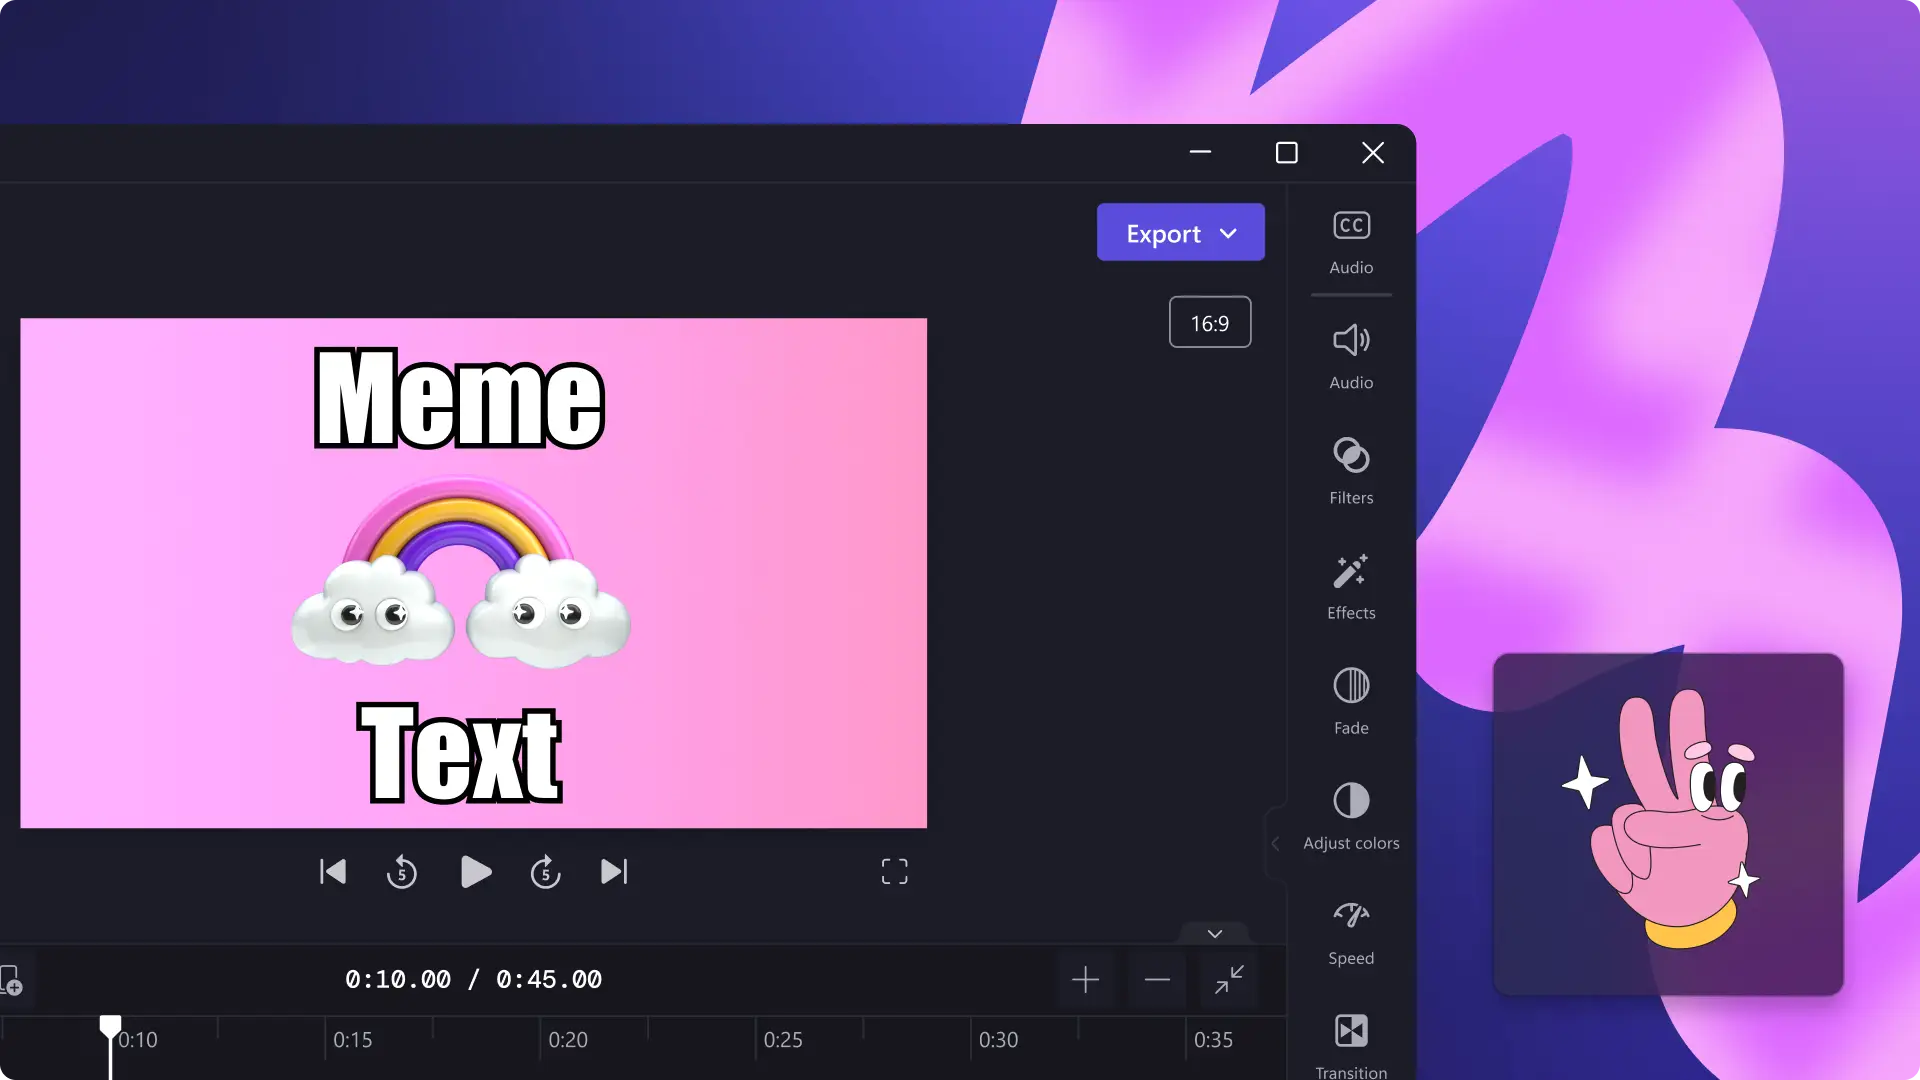
How to make video memes
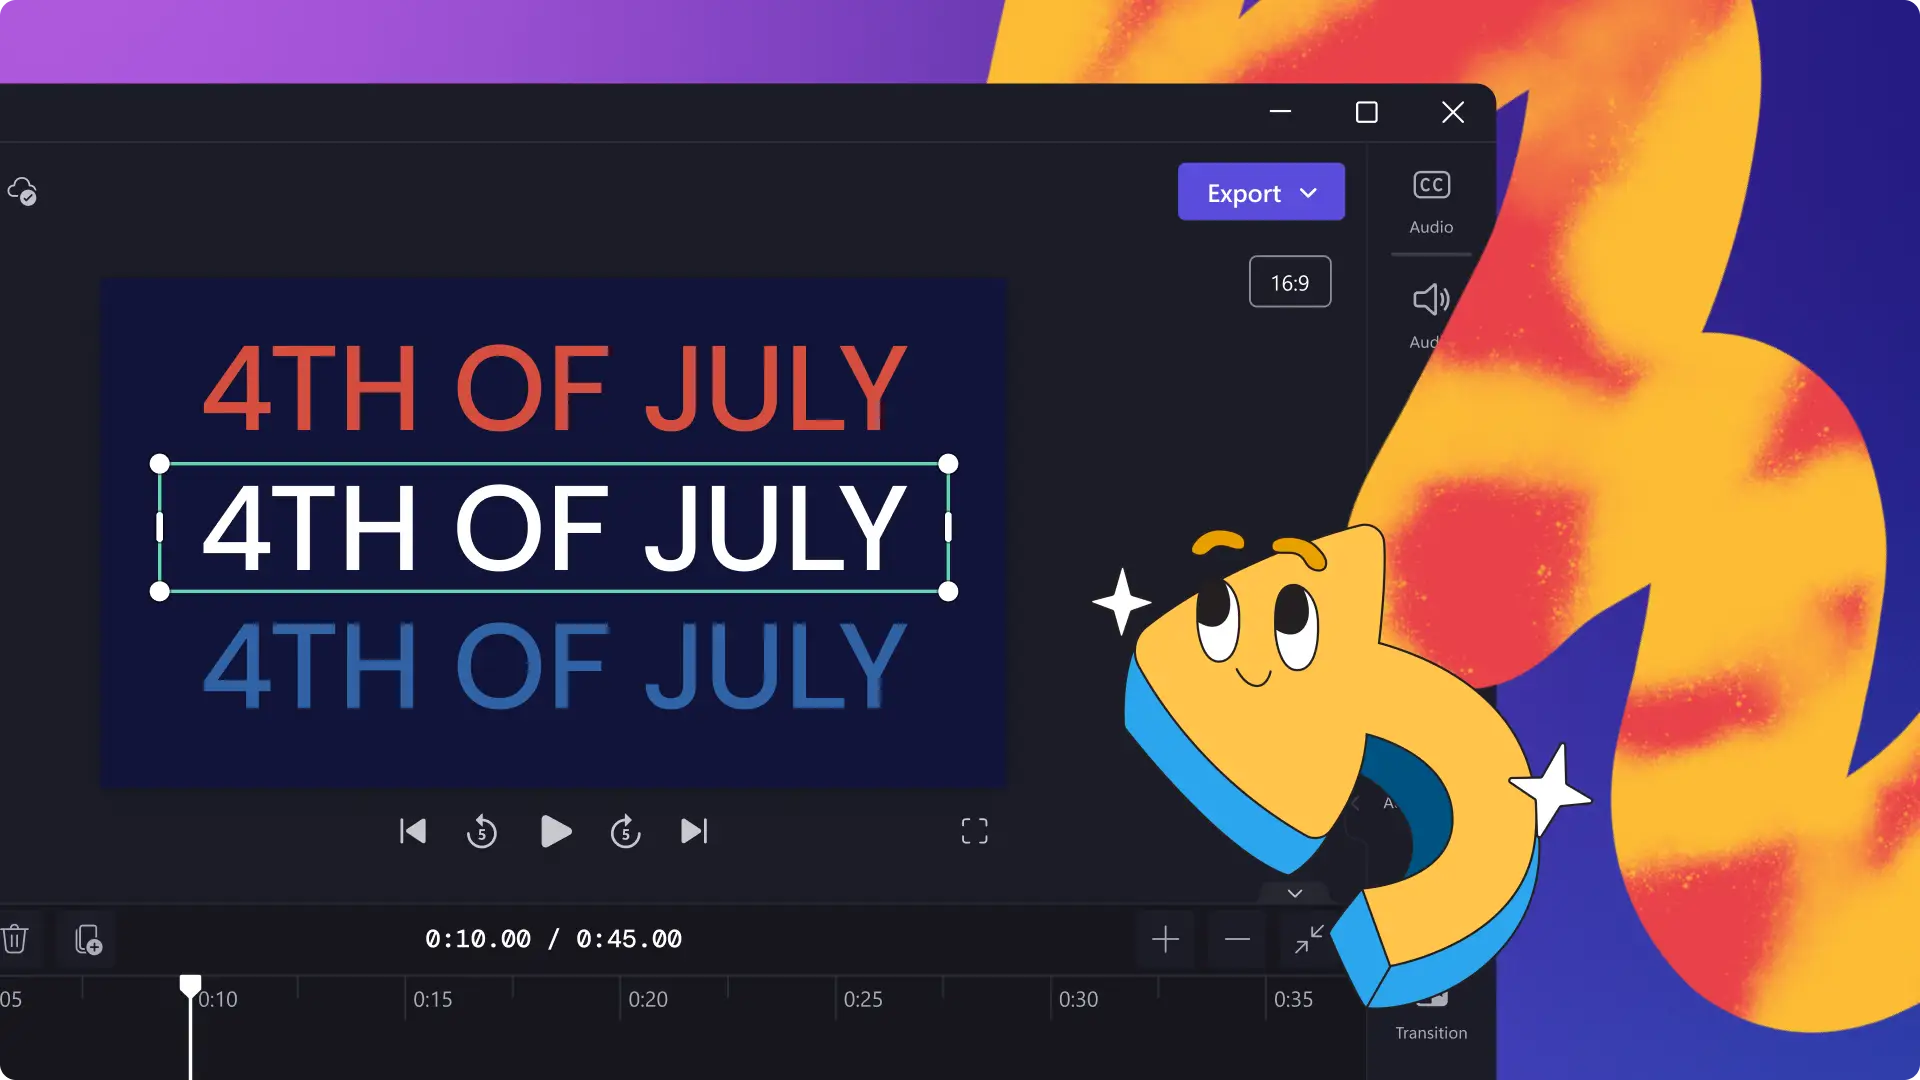
15 video ideas to celebrate Fourth of July

How to use autocaptions in Clipchamp
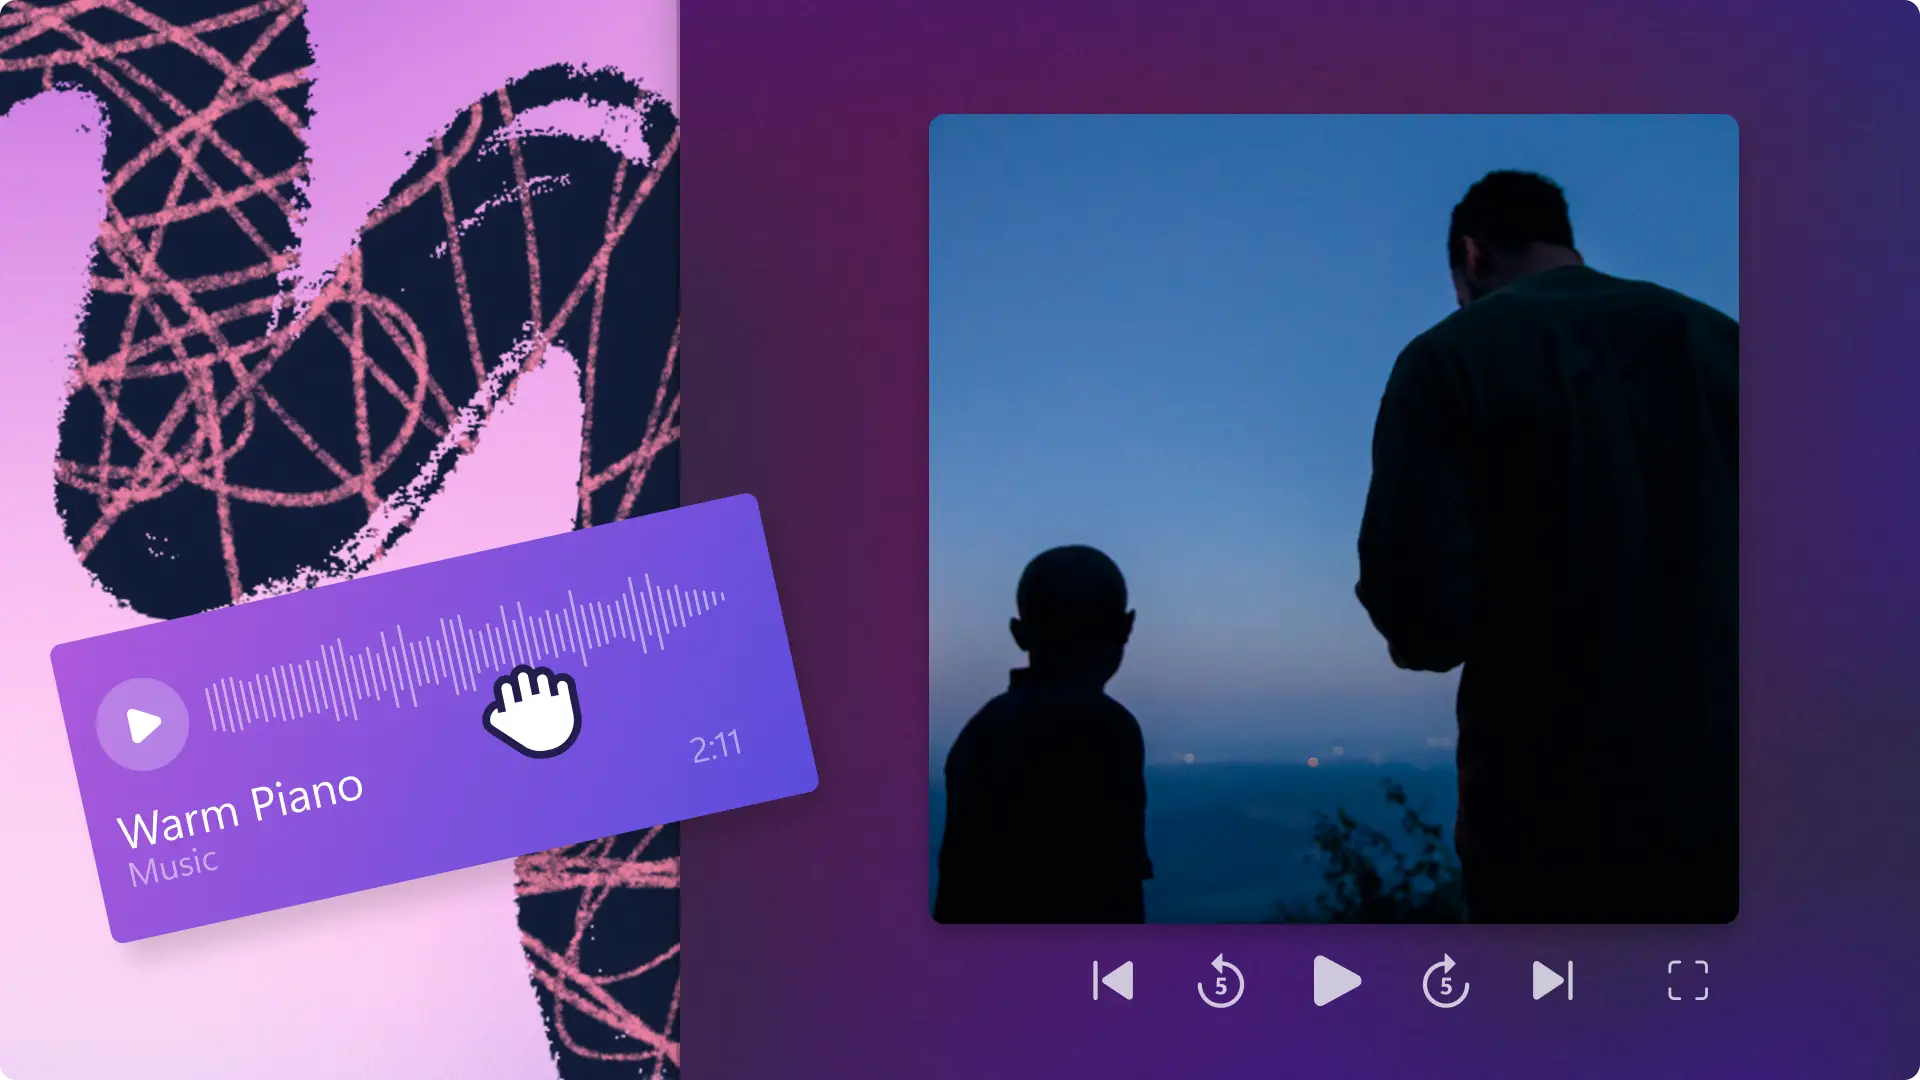
15 Father’s Day video ideas


Explore topics
AI text to speech articlesAI video editingBusiness videosCompany newsEducational videosFacebook videosGaming video articlesHolidays and events articlesInstagram video articlesLinkedIn video articlesTikTok articlesVideo audio editingVideo editingVideo effects articlesVideo marketingVideo production tipsWindows video editing articlesX (Twitter) video articlesYouTube articles